
OpenEPT Shield Board: Preliminary Analysis and Results
During the prototype testing of the OpenEPT board, as described here, we identified critical issues and key bottlenecks affecting the speed and reliability of our measurement concept for embedded systems. One major issue uncovered was the high noise level, primarily caused by the limited performance of the on boardADC and Nucleo board. This challenge was effectively addressed by introducing an external ADC. We selected the ADS9224R, which introduced new challenges related to interfacing it with standard STM32 interfaces. The challenges we encountered and the solutions we implemented are detailed in this blog post.
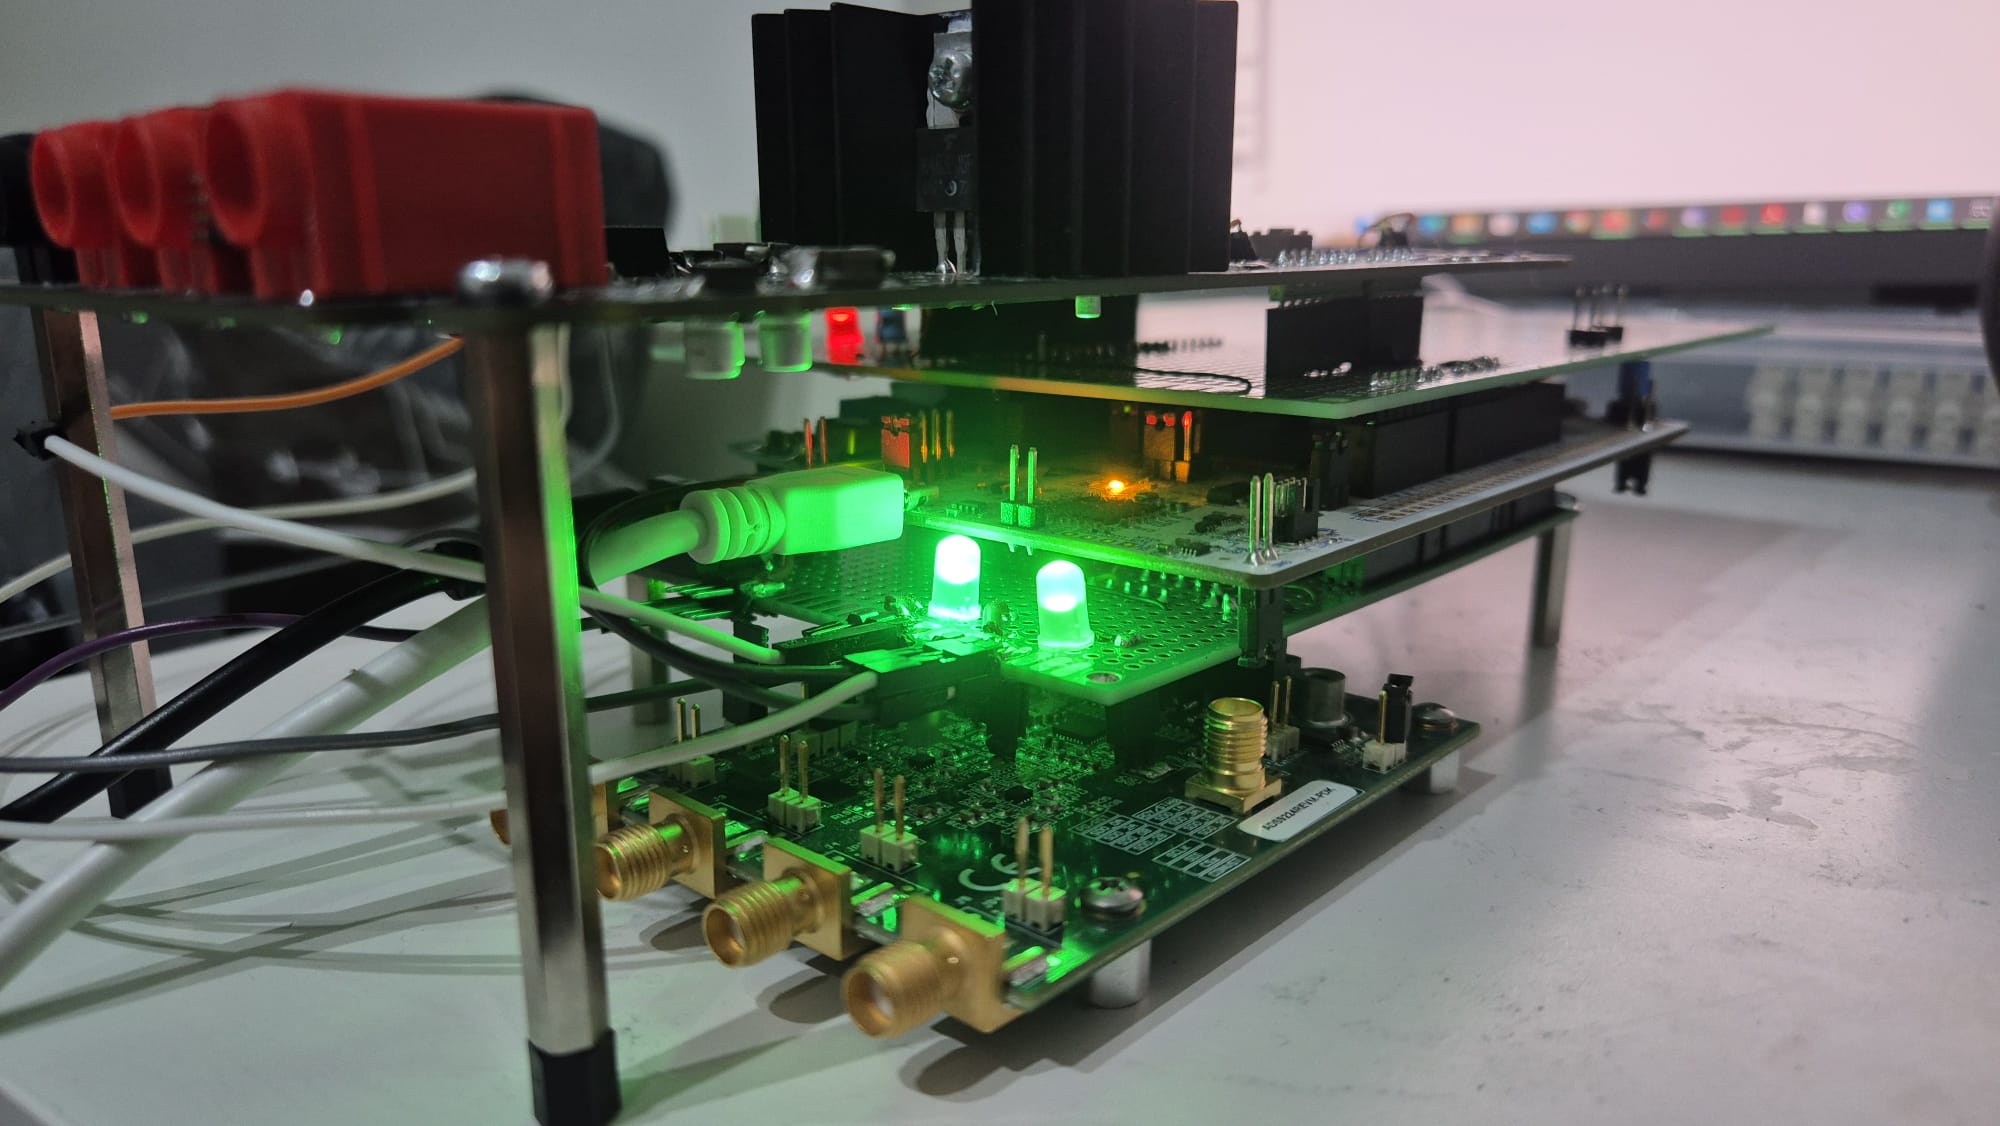
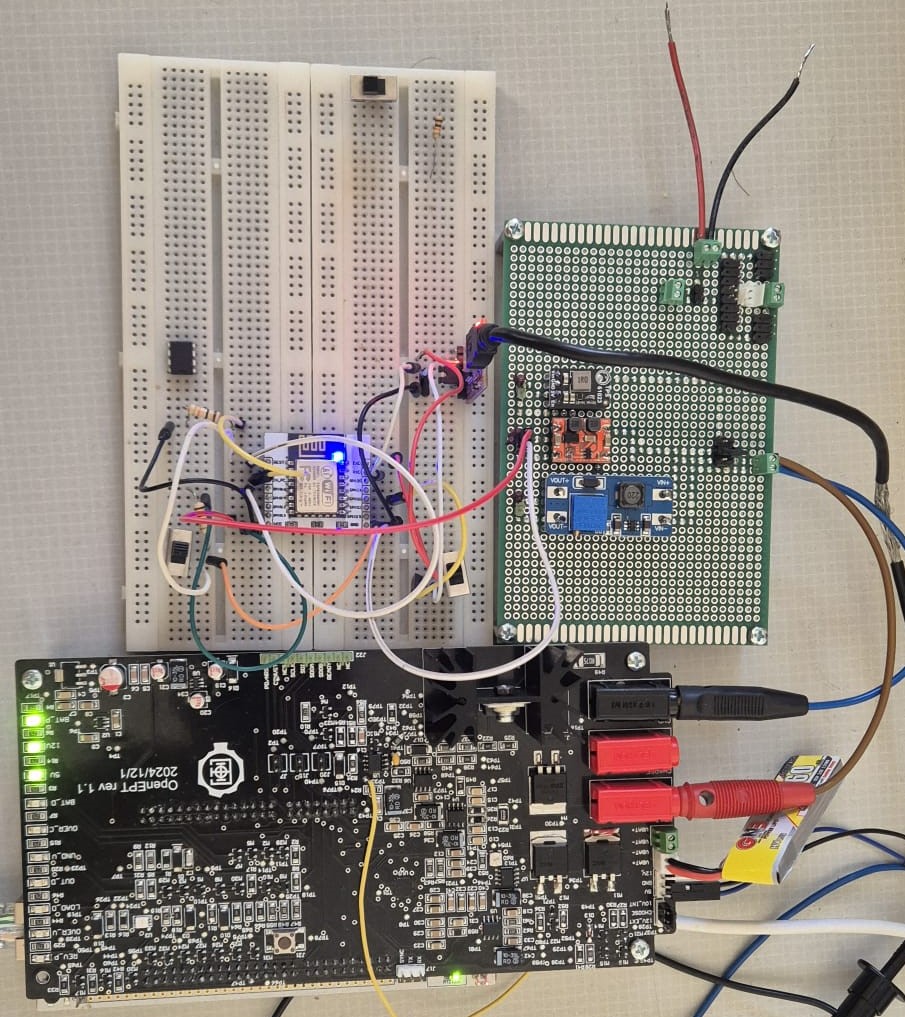
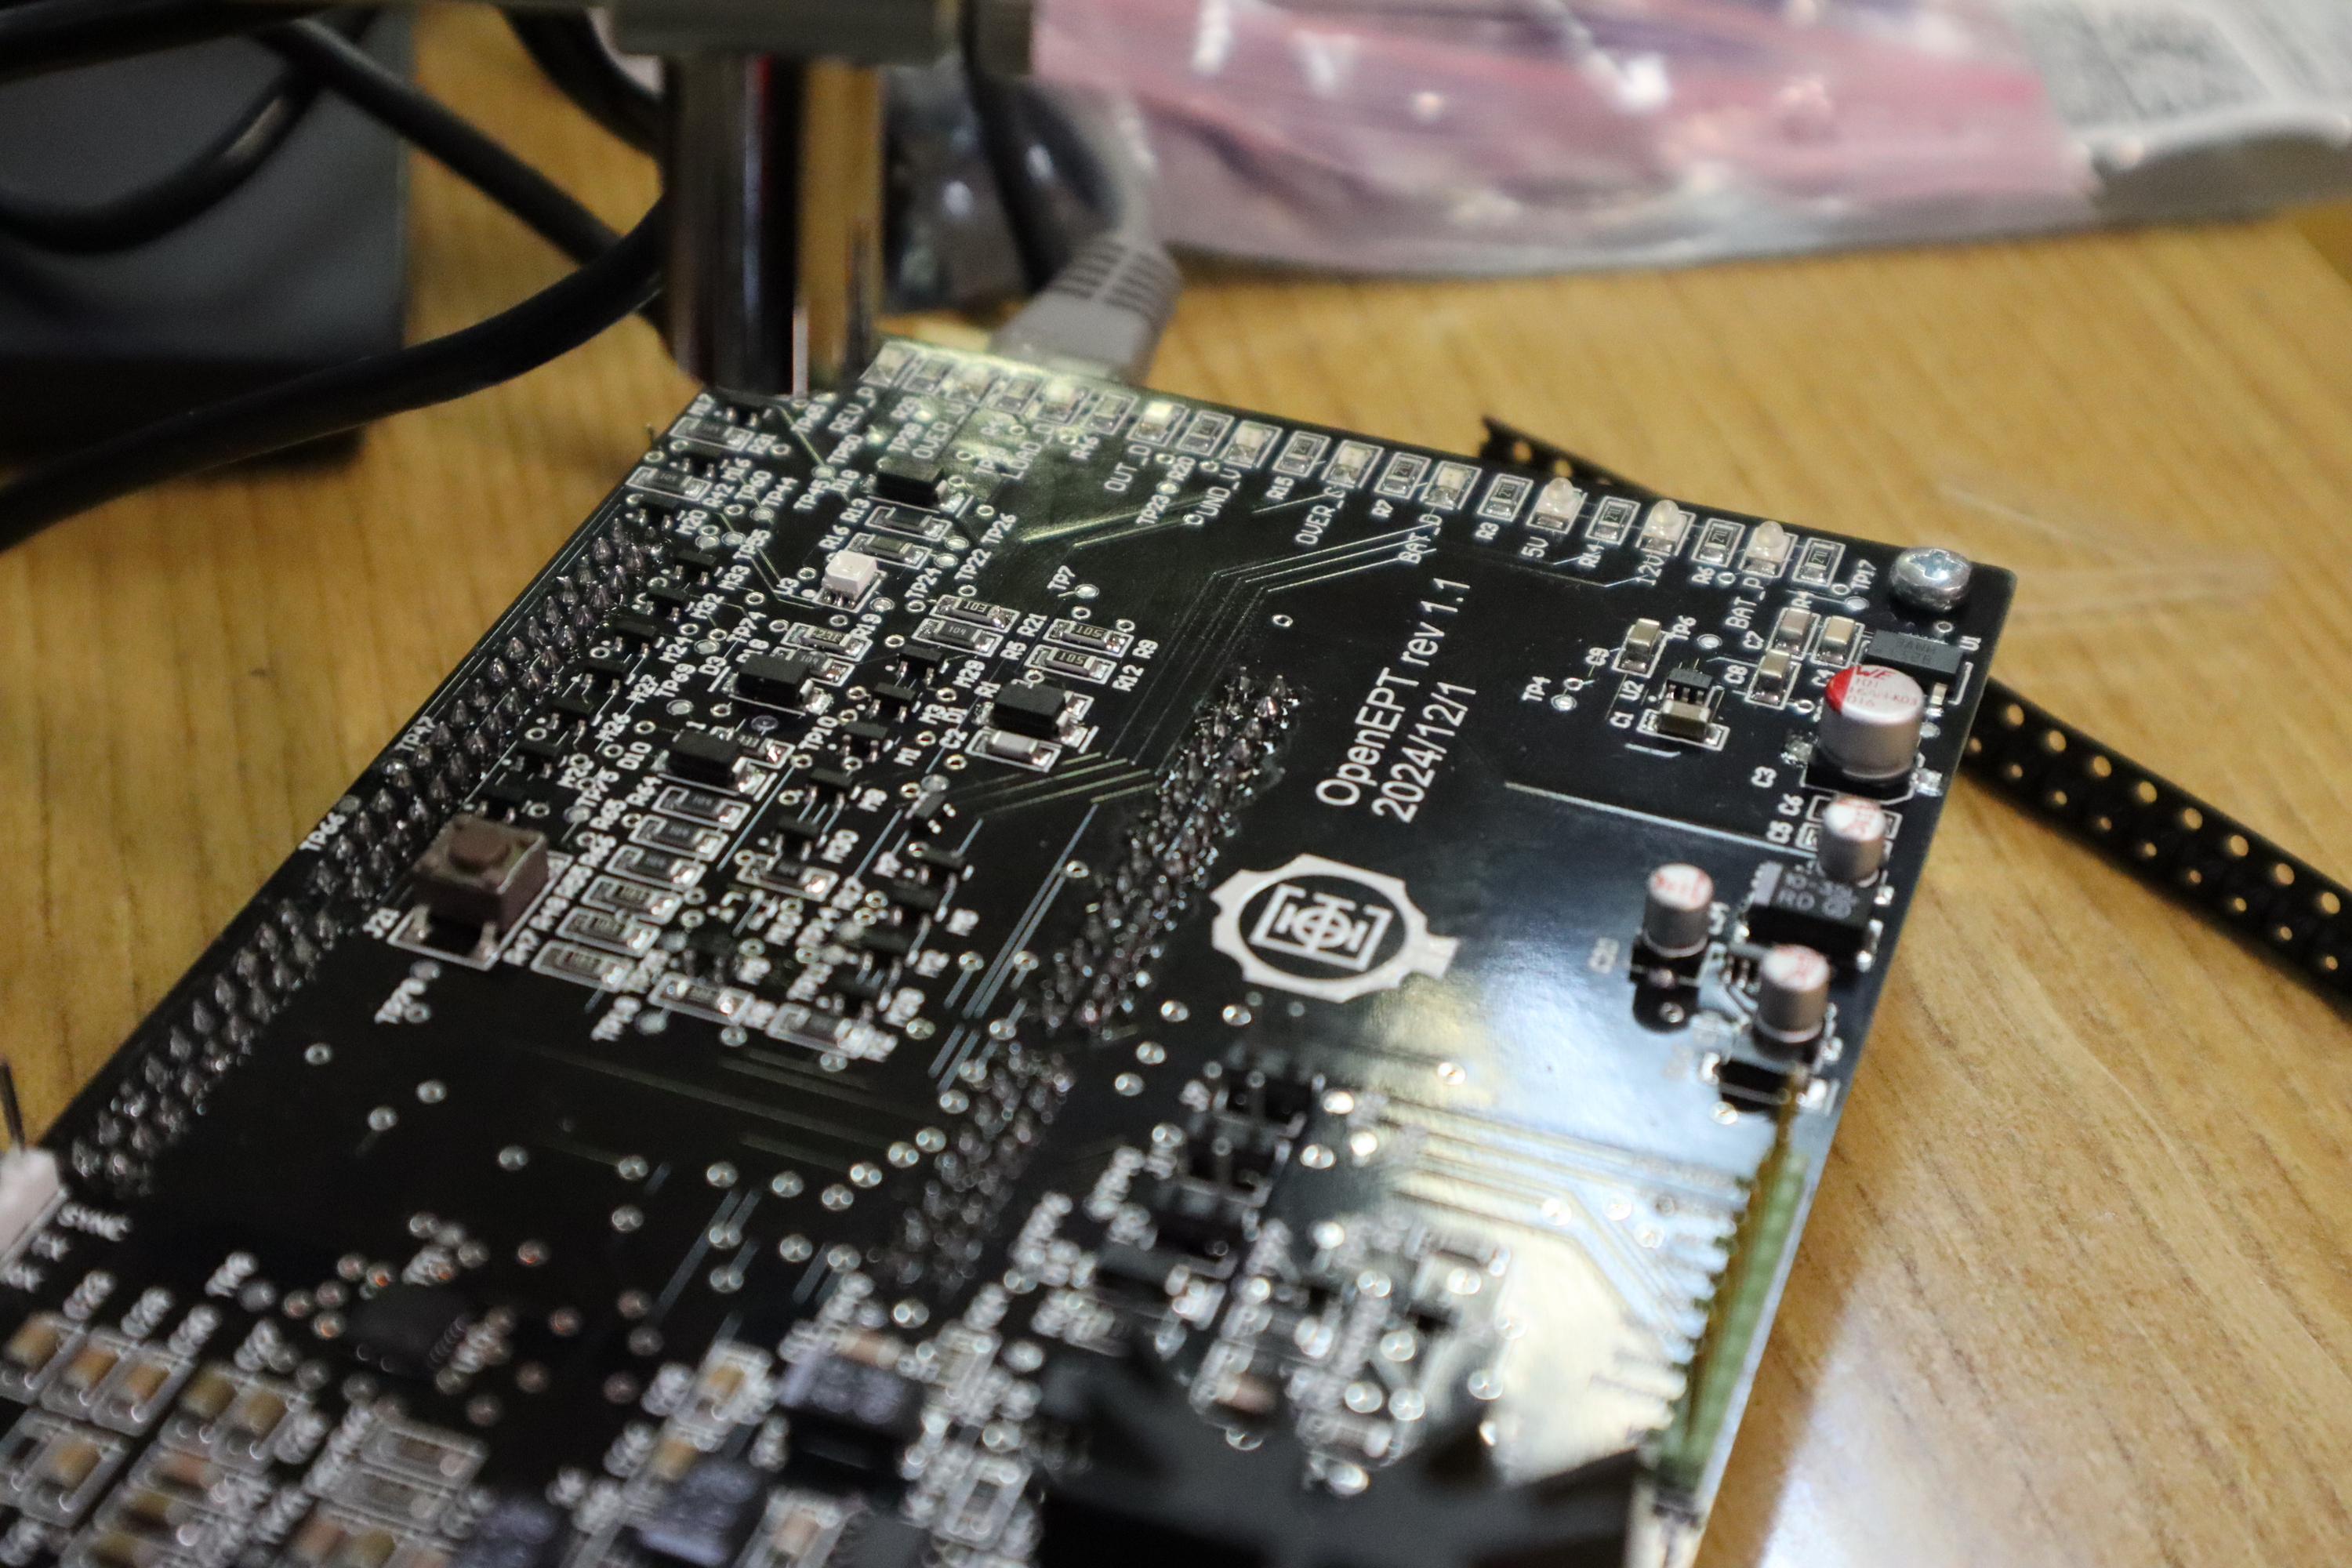
After intensive tests were conducted on the prototype board, and after issues are identified, all fixes are applied and new version that includes all these fixes is designed and send for manufacturing. After it arrives, soldering of the components is done and new testing begins. Atmosphere from testing in laboratory is presented thought this post while pure testing results will be presented in this blog post.
The shield board allows OpenEPT hardware users to integrate it with any MCU board. The Figure 3 illustrates the pin layout of the shield board.
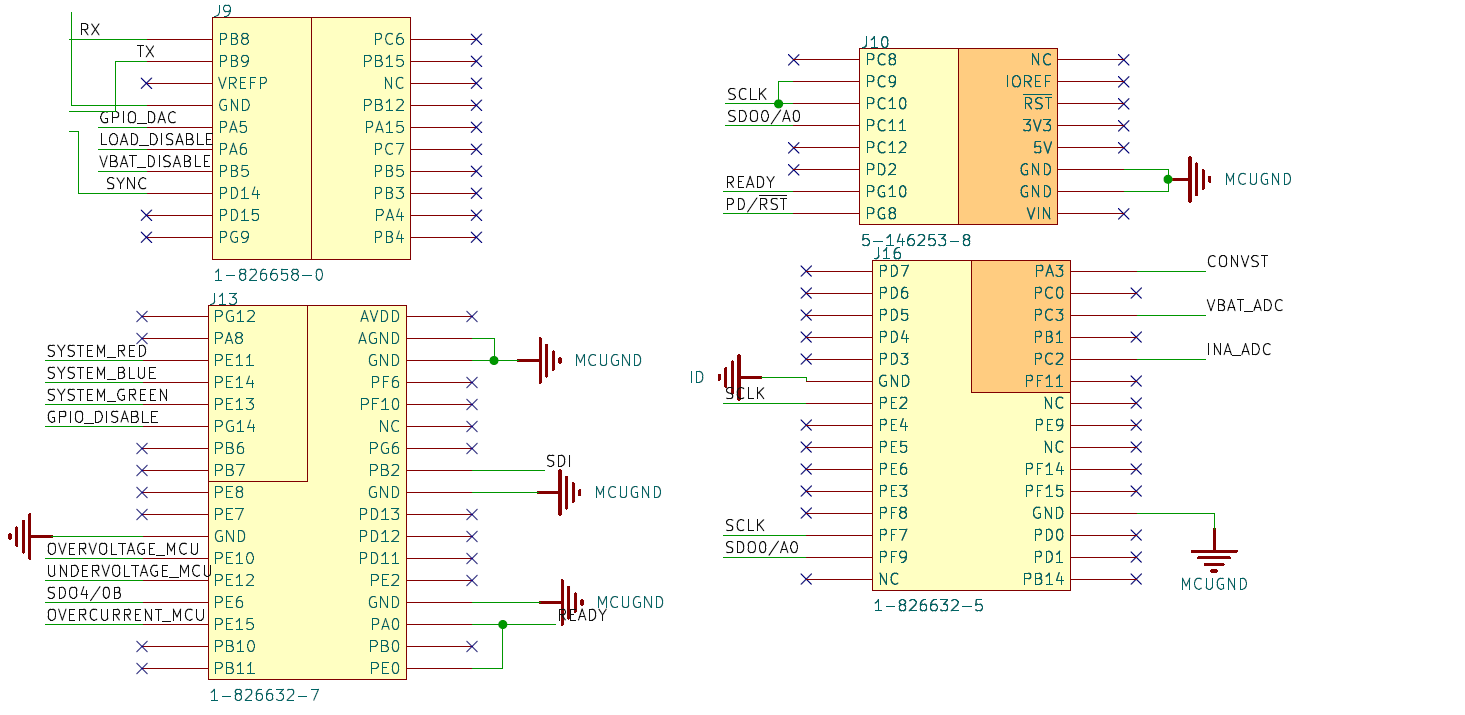
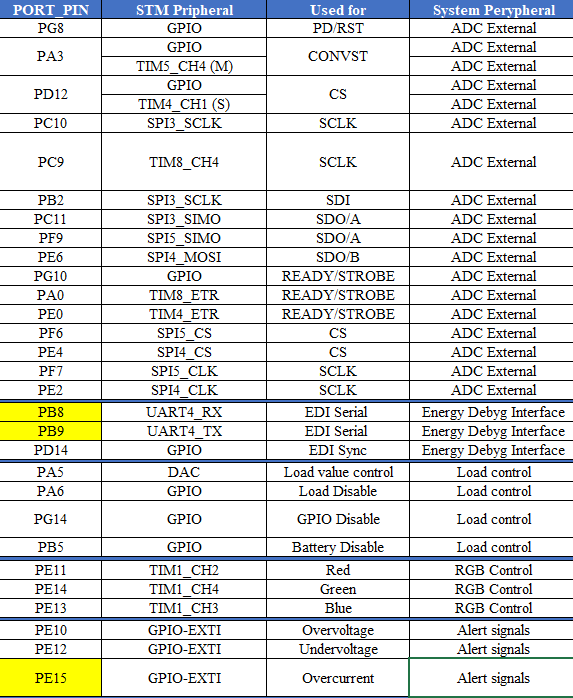
In our case, we utilized this shield board with the Nucleo-H755ZI-Q development board. Figure 4provides a summary of all the pins used to connect this MCU-based development board with the OpenEPT shield board.
Materials
The latest materials related to the OpenEPT shield board can be found in the Materials section of the website, under the Documentation/Hardware subsection. Currently, the available resources include:
- BOM List
- OpenEPT Schield board schematic
- KiCAD Source files
Testing
As it was case in testing prototype version, within the testing of OpenEPT final shield board we also conducted two testing scenarios:
1. Battery discharge test
2. Measuring consumption of ESP32 module
Testing Scenario 1: Battery Discharge
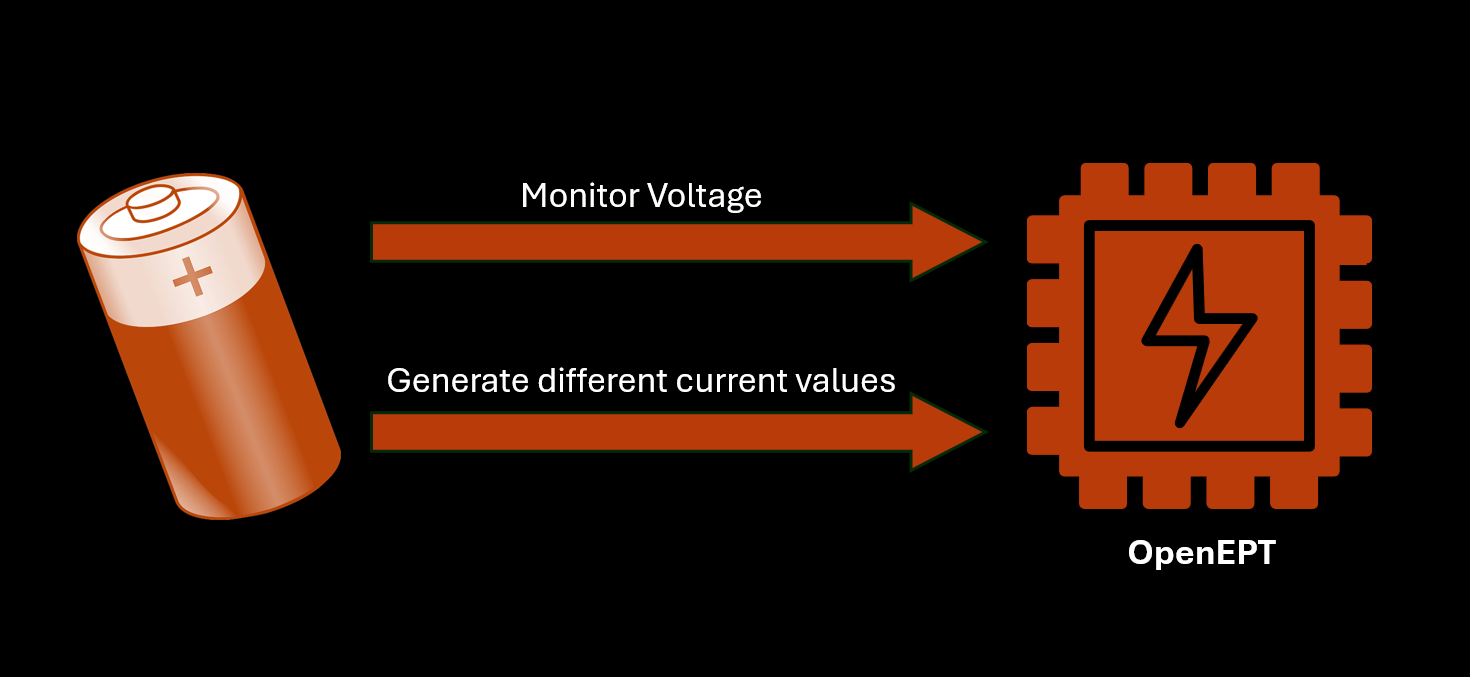
In the first testing scenario, the focus was on battery discharge. This involved generating various current values and monitoring the battery's voltage response. The overall concept of the testing scenario is illustrated in Figure 5.
Similar to how a prototype board operates, this setup connected the battery to periodically generate different discharge currents. The sampling rate during testing was set to 10 us, and the resulting data was logged into corresponding files. Once the test was completed, the logged data was analyzed using the DataAnalyzer window, which is integrated into the OpenEPT GUI application. This window displays voltage, current, and consumption values obtained during the testing phase, as shown in Figure 6.
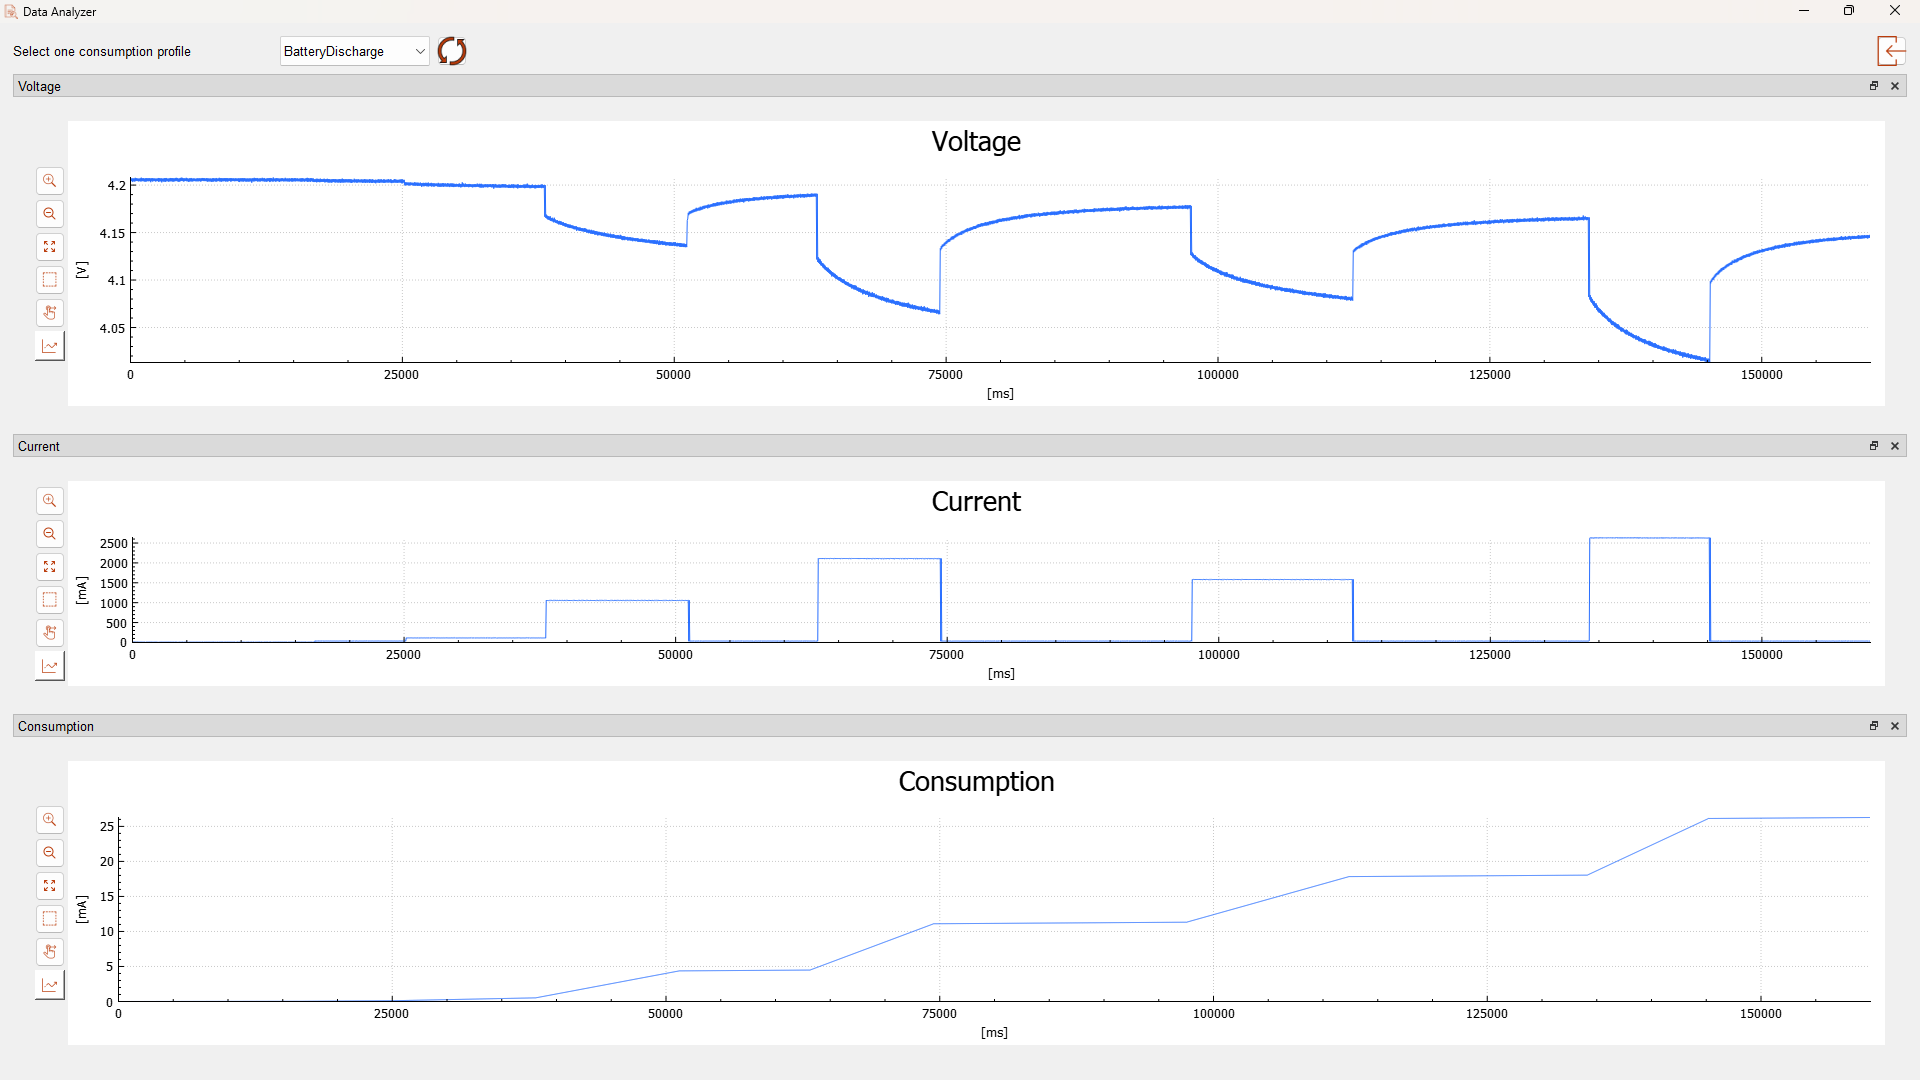
Figure 6 illustrates five discharge impulses with varying amplitudes (~100 mA, 1000 mA, 2000 mA, 1500 mA, and 2500 mA) along with their corresponding voltage responses. It also highlights how consumption changes with current values: consumption rises significantly during periods of high current and remains steady when the current returns to zero. The battery discharge test confirmed the overall functionality of the OpenEPT hardware. Moreover, the test provided valuable insights into the noise levels on the current channel. Figures 5 and 6 further detail specific data segments: Figure 7 focuses on the current data at approximately 2.6 A, while Figure 8 presents the voltage data at around 4.2 V.
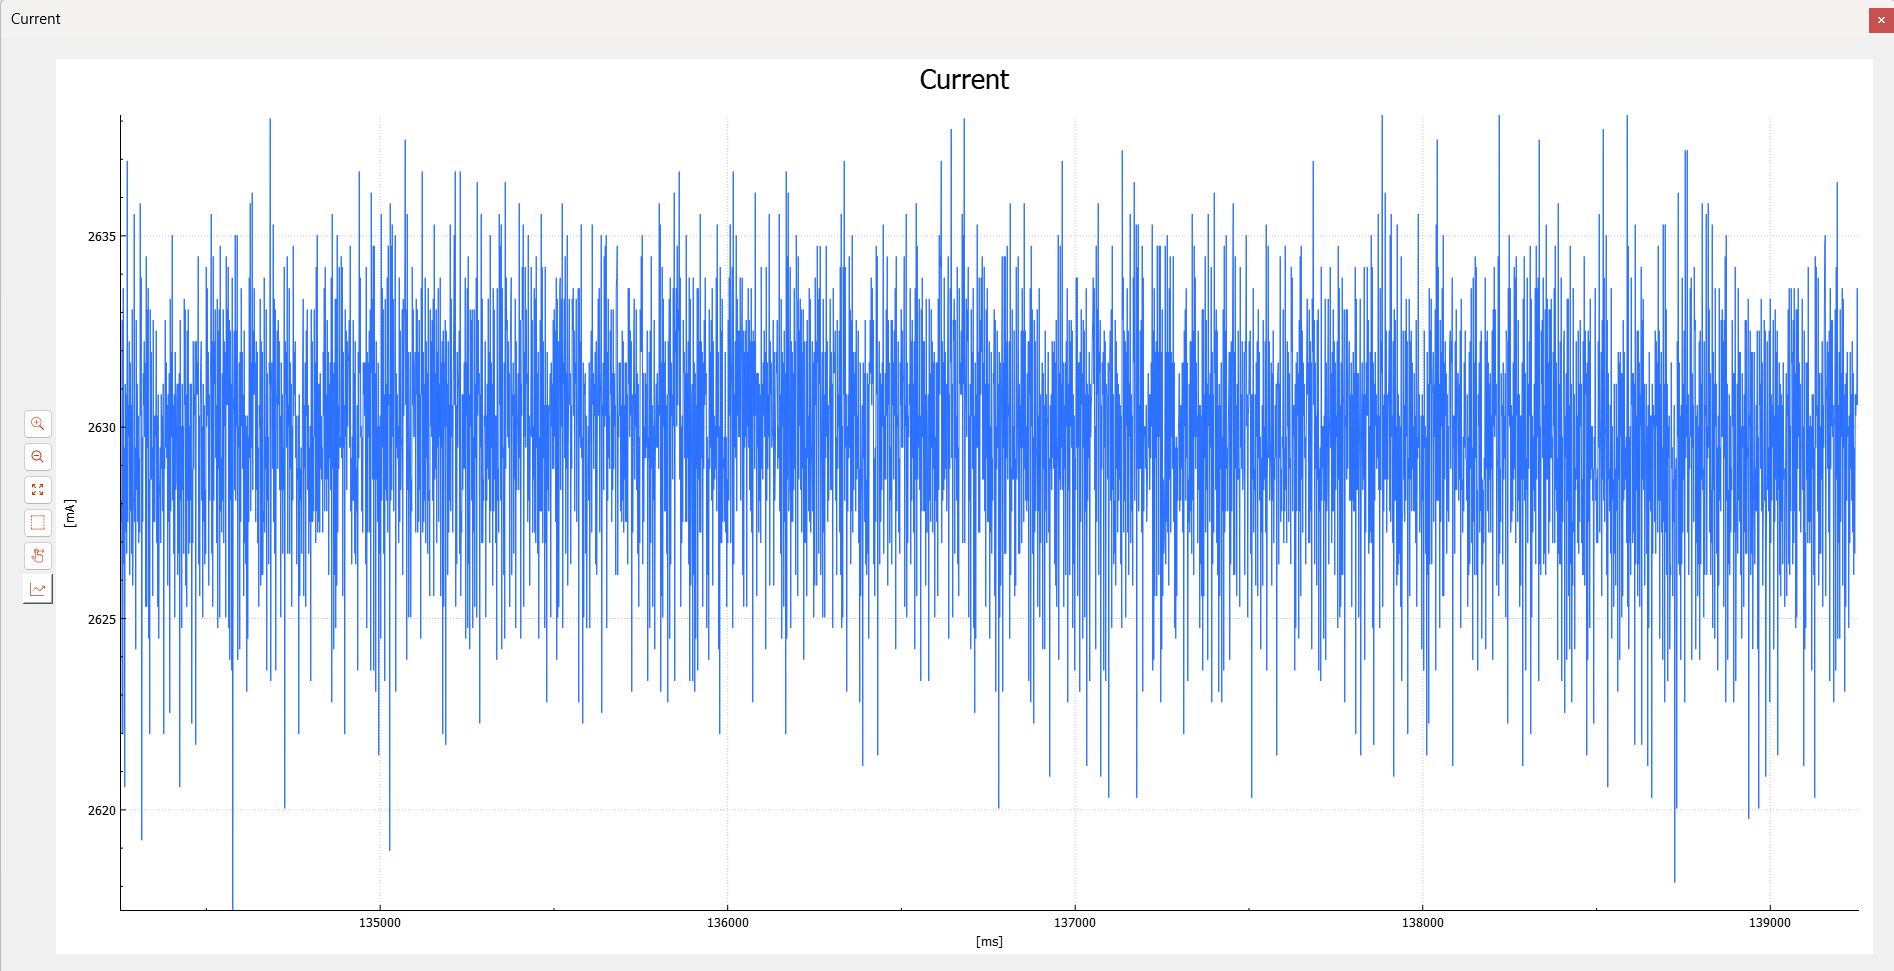
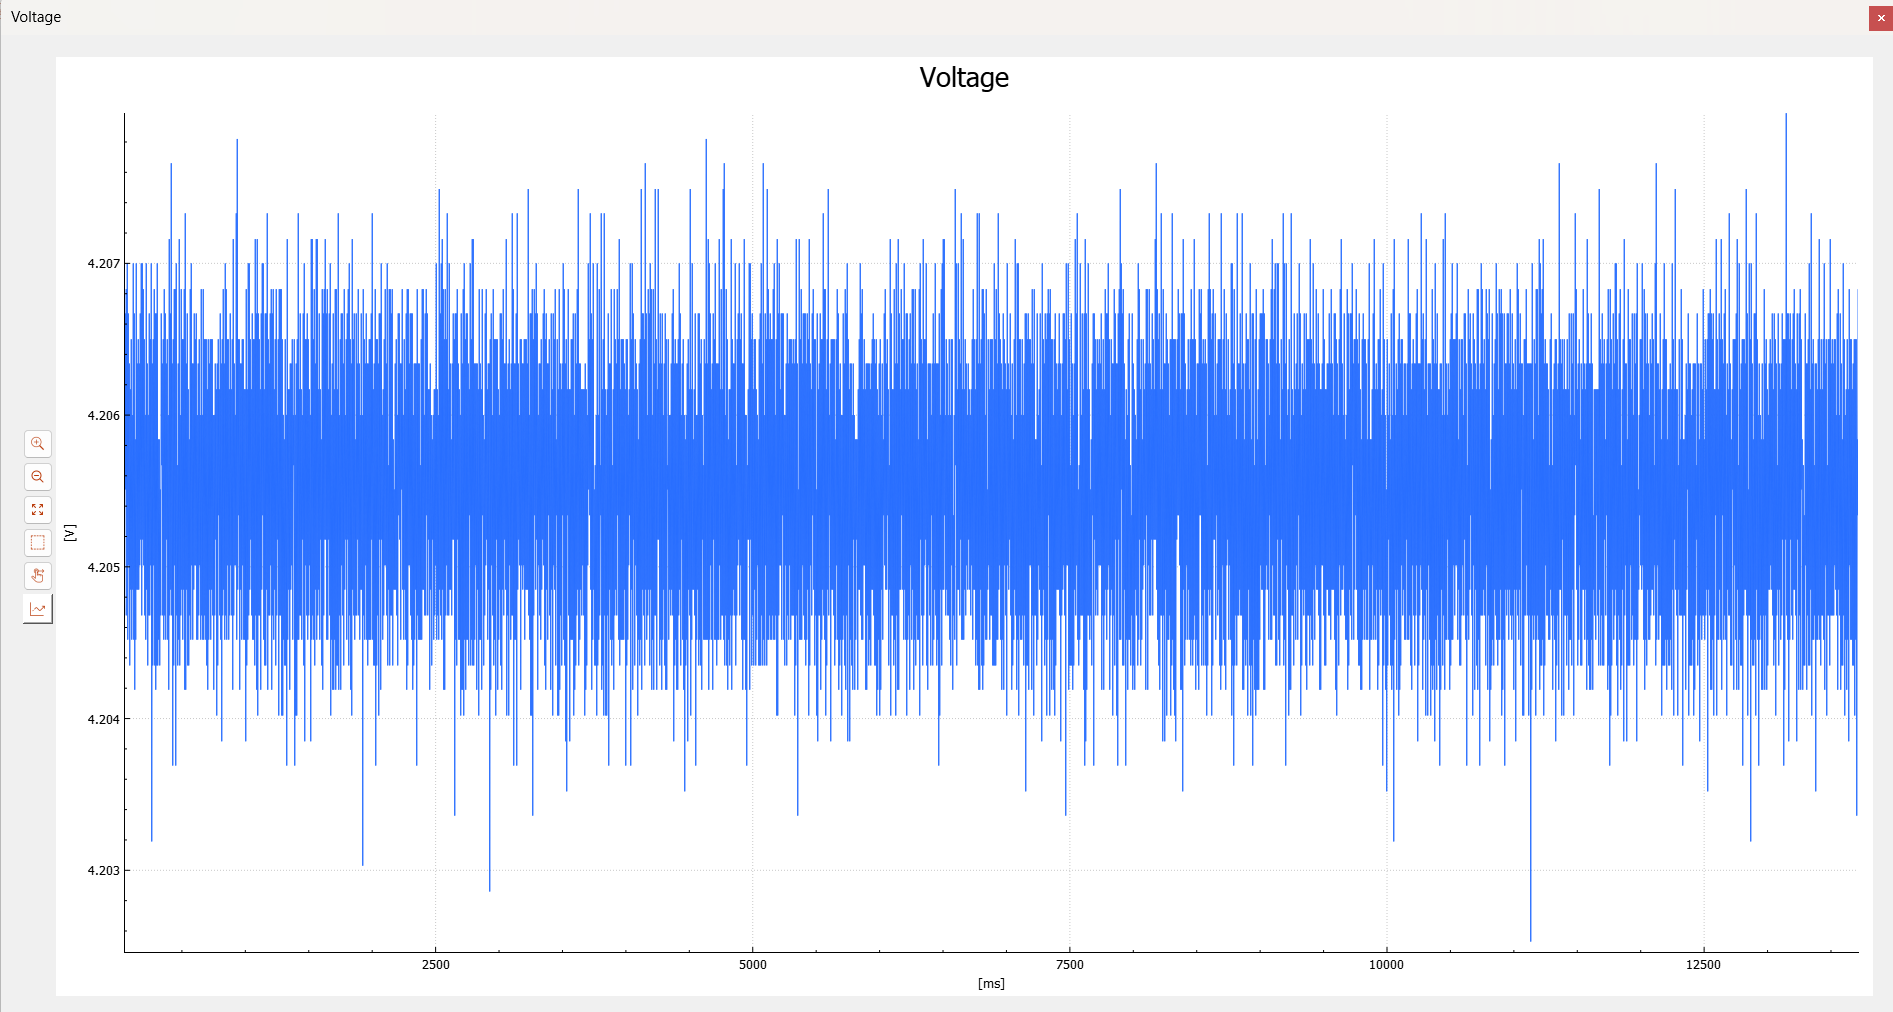
In this segment, the average current value was calculated to be 2630.04 mA, with a standard deviation of approximately 2.77 mA. The maximum noise amplitude, recorded with a sampling interval of 0.1 ms, was 13.33 mA (less than 0.5% of the average current). The current rise time was also measured to be approximately 20 µs. For the same segment, the average voltage value was 4.21 V, with a standard deviation of 0.68 mV and a maximum amplitude of 2.99 mV, representing 0.07% of the average current. These findings validate the effectiveness of integrating an external ADC and improving the filter characteristics of OpenEPT.
Testing Scenario 2: Measuring Consumption
The second testing scenario involved measuring the consumption of the ESP32 Wi-Fi module by using shield board that is powered by LiPo battery. The overall concept of the testing scenario is illustrated in Figure 7 while testing setup is illustrated on Figure 9.
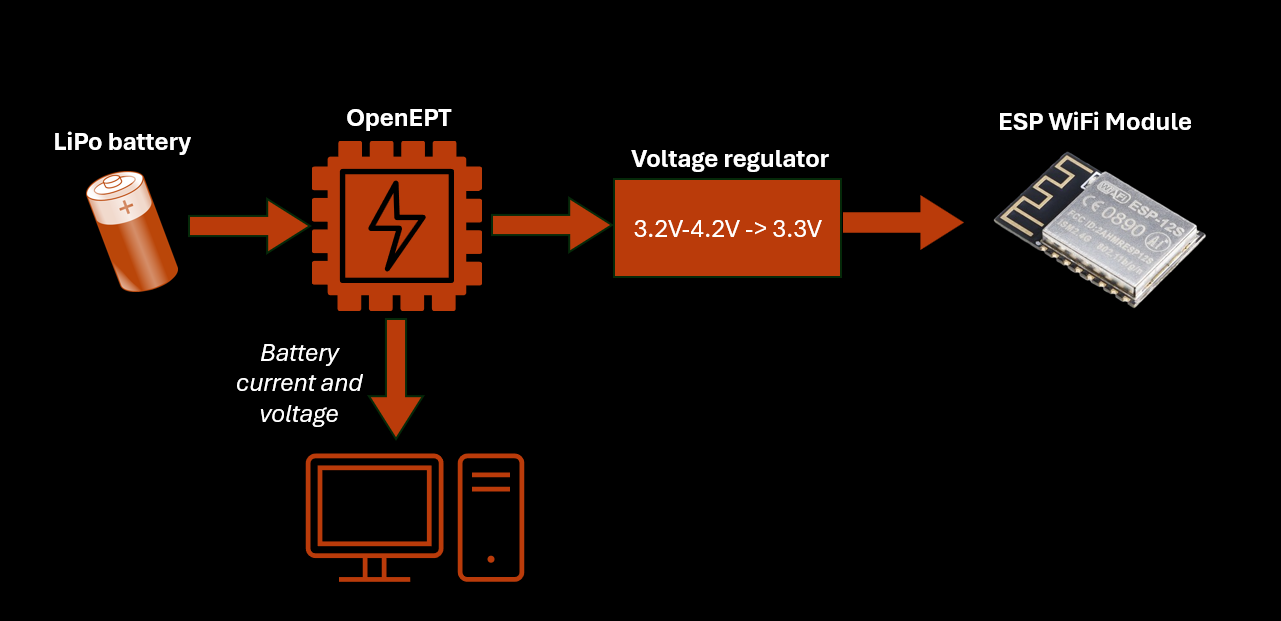

The ESP32 module was selected for this testing scenario and programmed with a program which workflow diagram is outlined in the Figure 10.
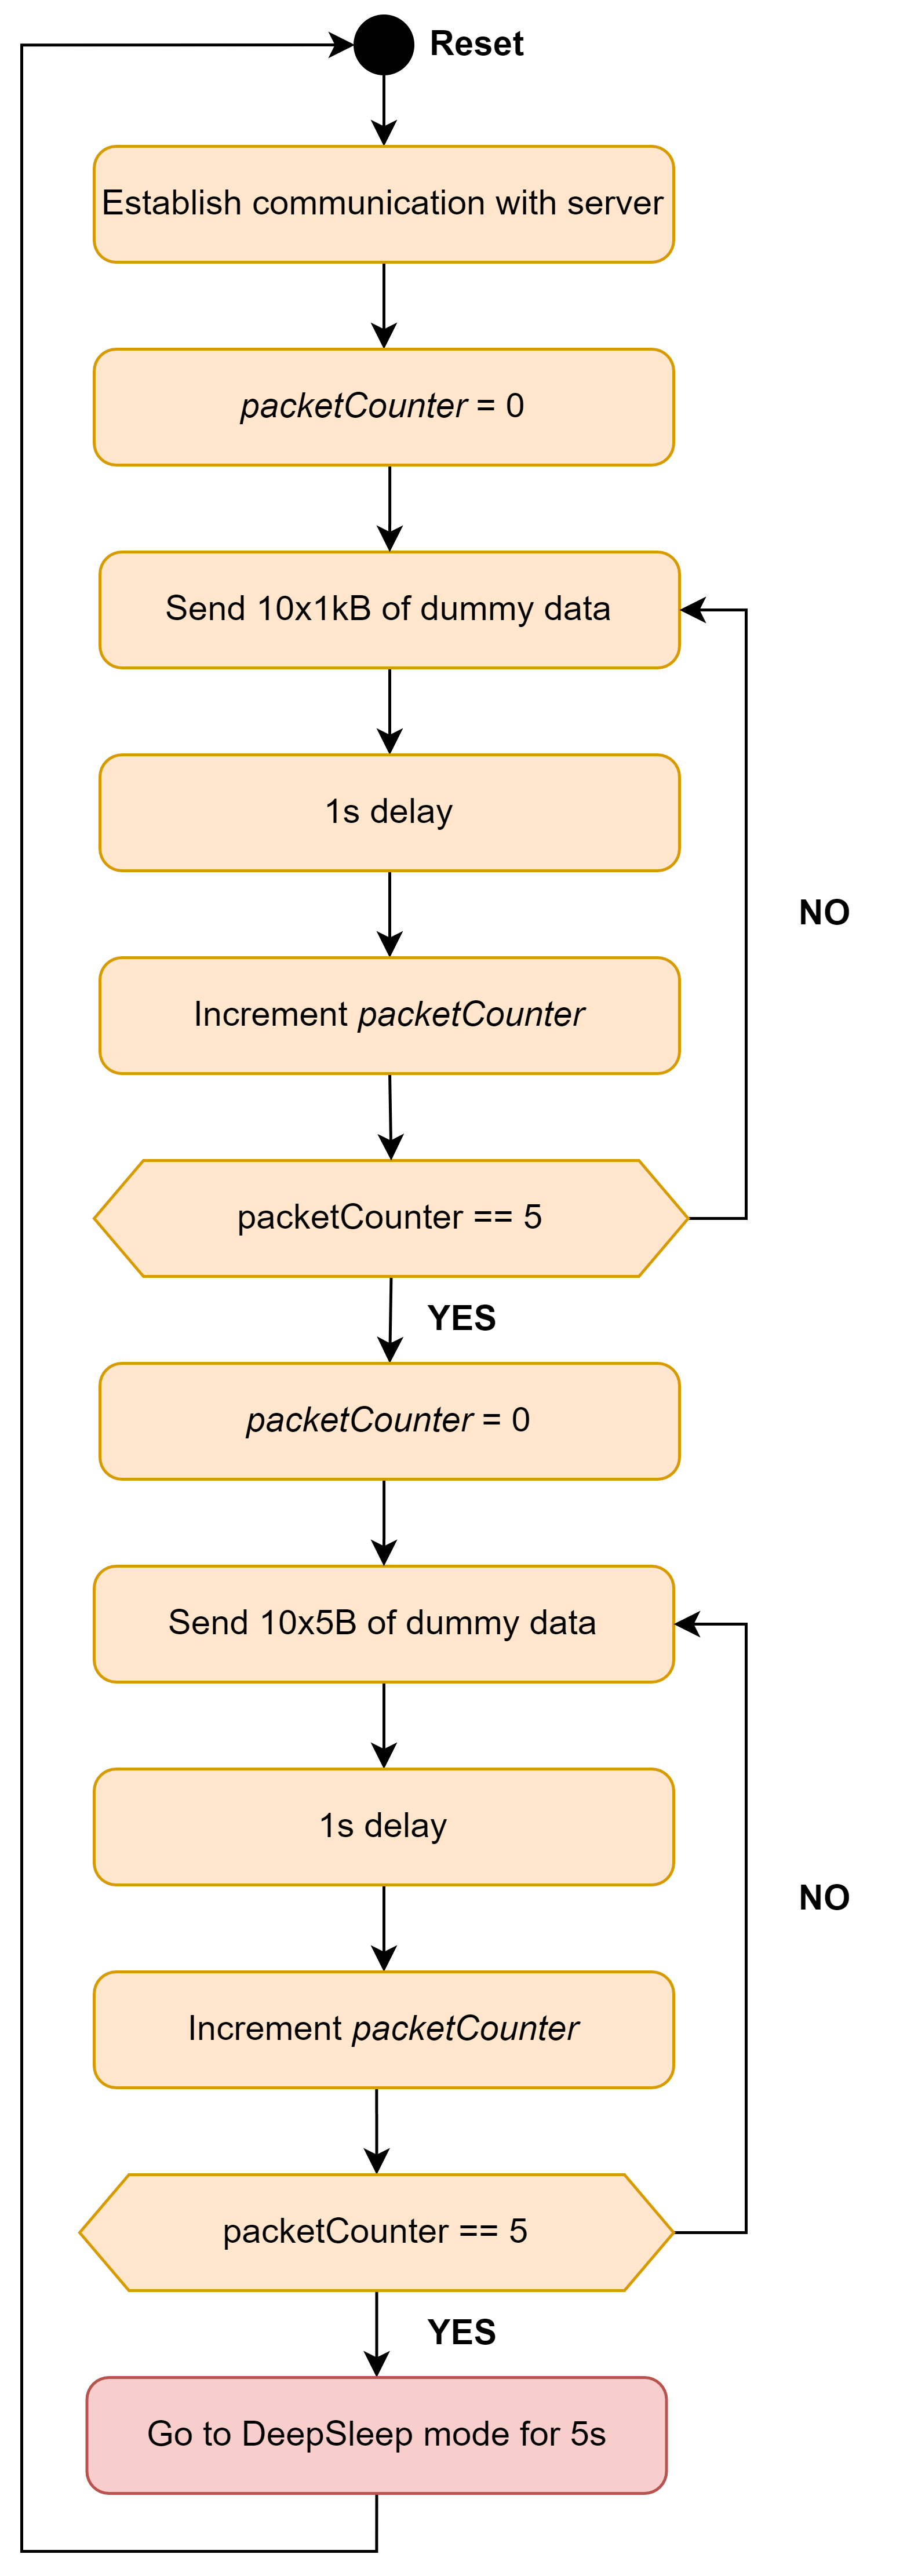
The diagram can be summarized as follows: first, transmit 5 sequence of 10 relatively large data of 1KB with a 1-second delay between each transmission. Then, send 5 arrays of 10 relatively small data of 5B, also with a 1-second delay between each. Data are transmitted over UDP protocol. At the end, EPS32 go to DeepSleep mode.
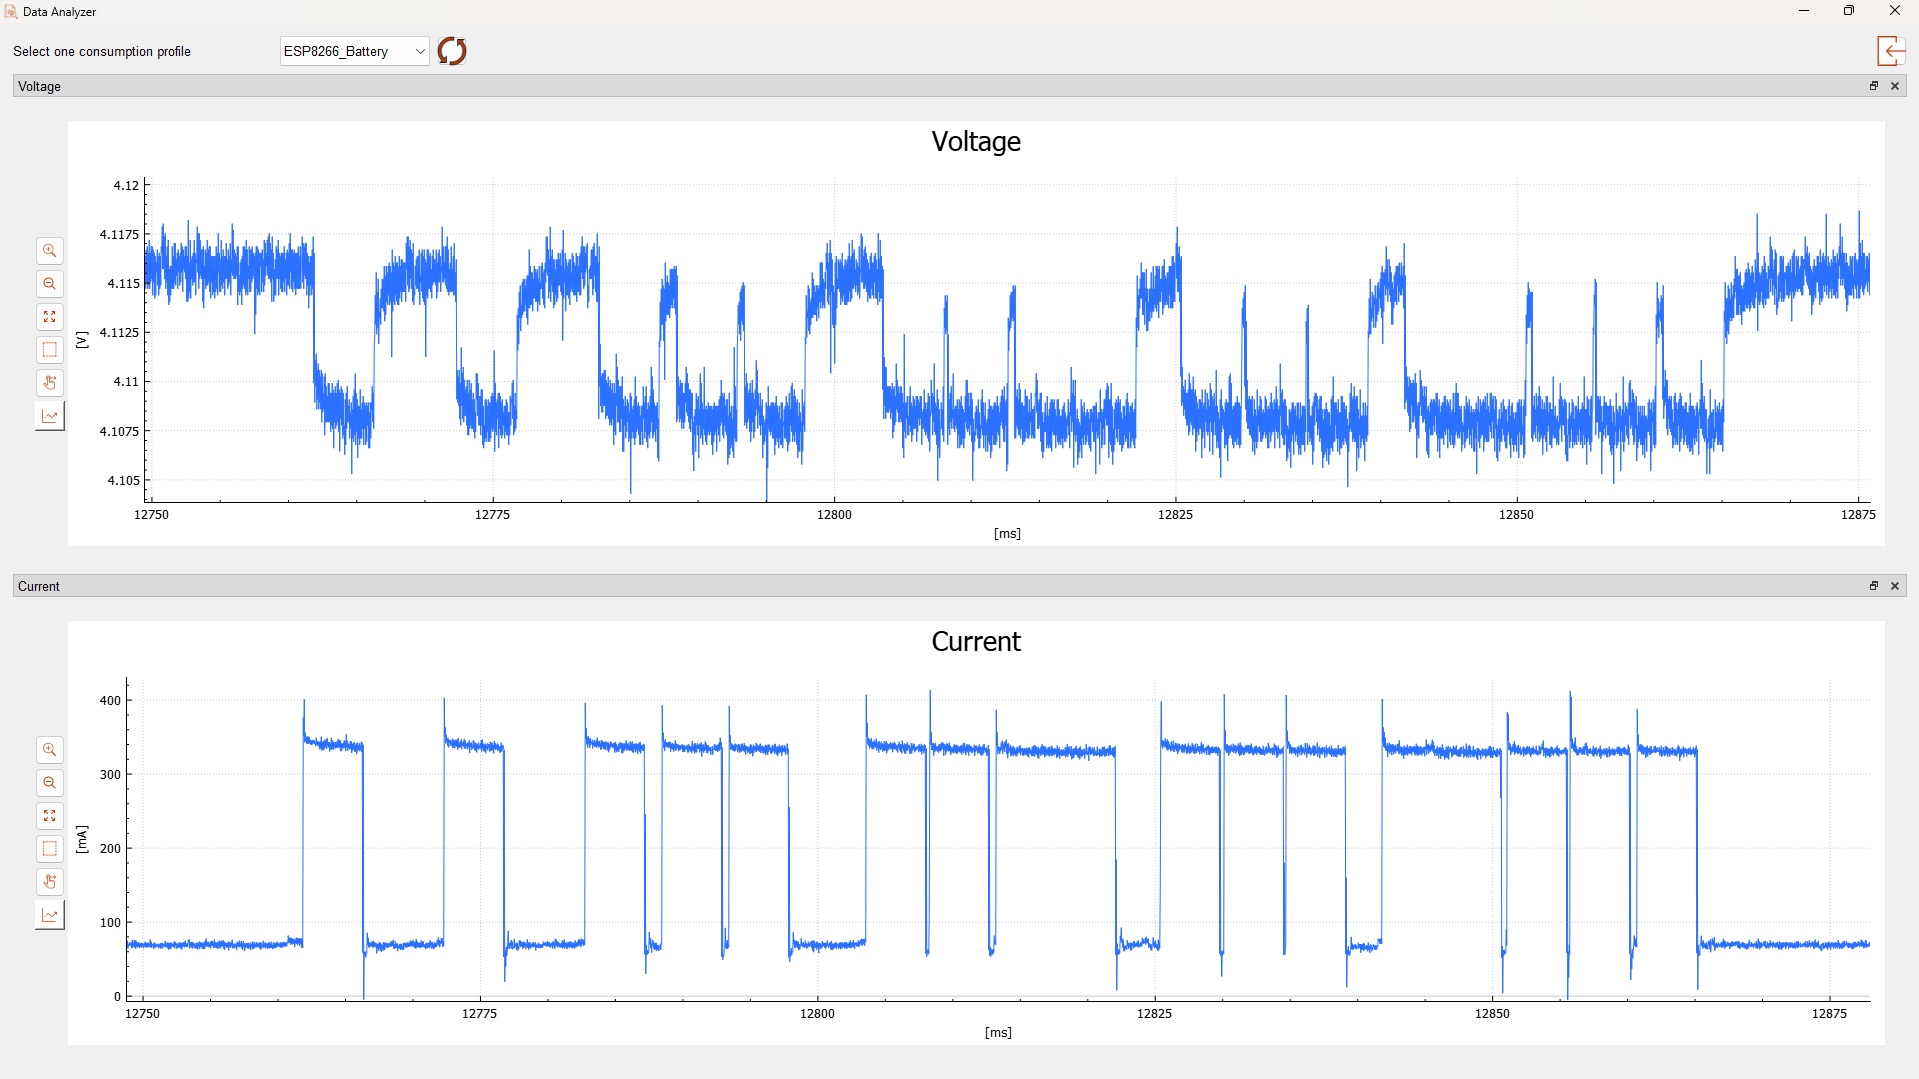
Once the program is downloaded to the ESP32, voltage and current acquisition begins on the OpenEPT hardware with a sampling period of 100 µs, monitoring three cycles of the previously described program. During acquisition, the data is logged to a file and later loaded into the DataAnalyzer window of the OpenEPT GUI application. The results are presented in Figure 11.
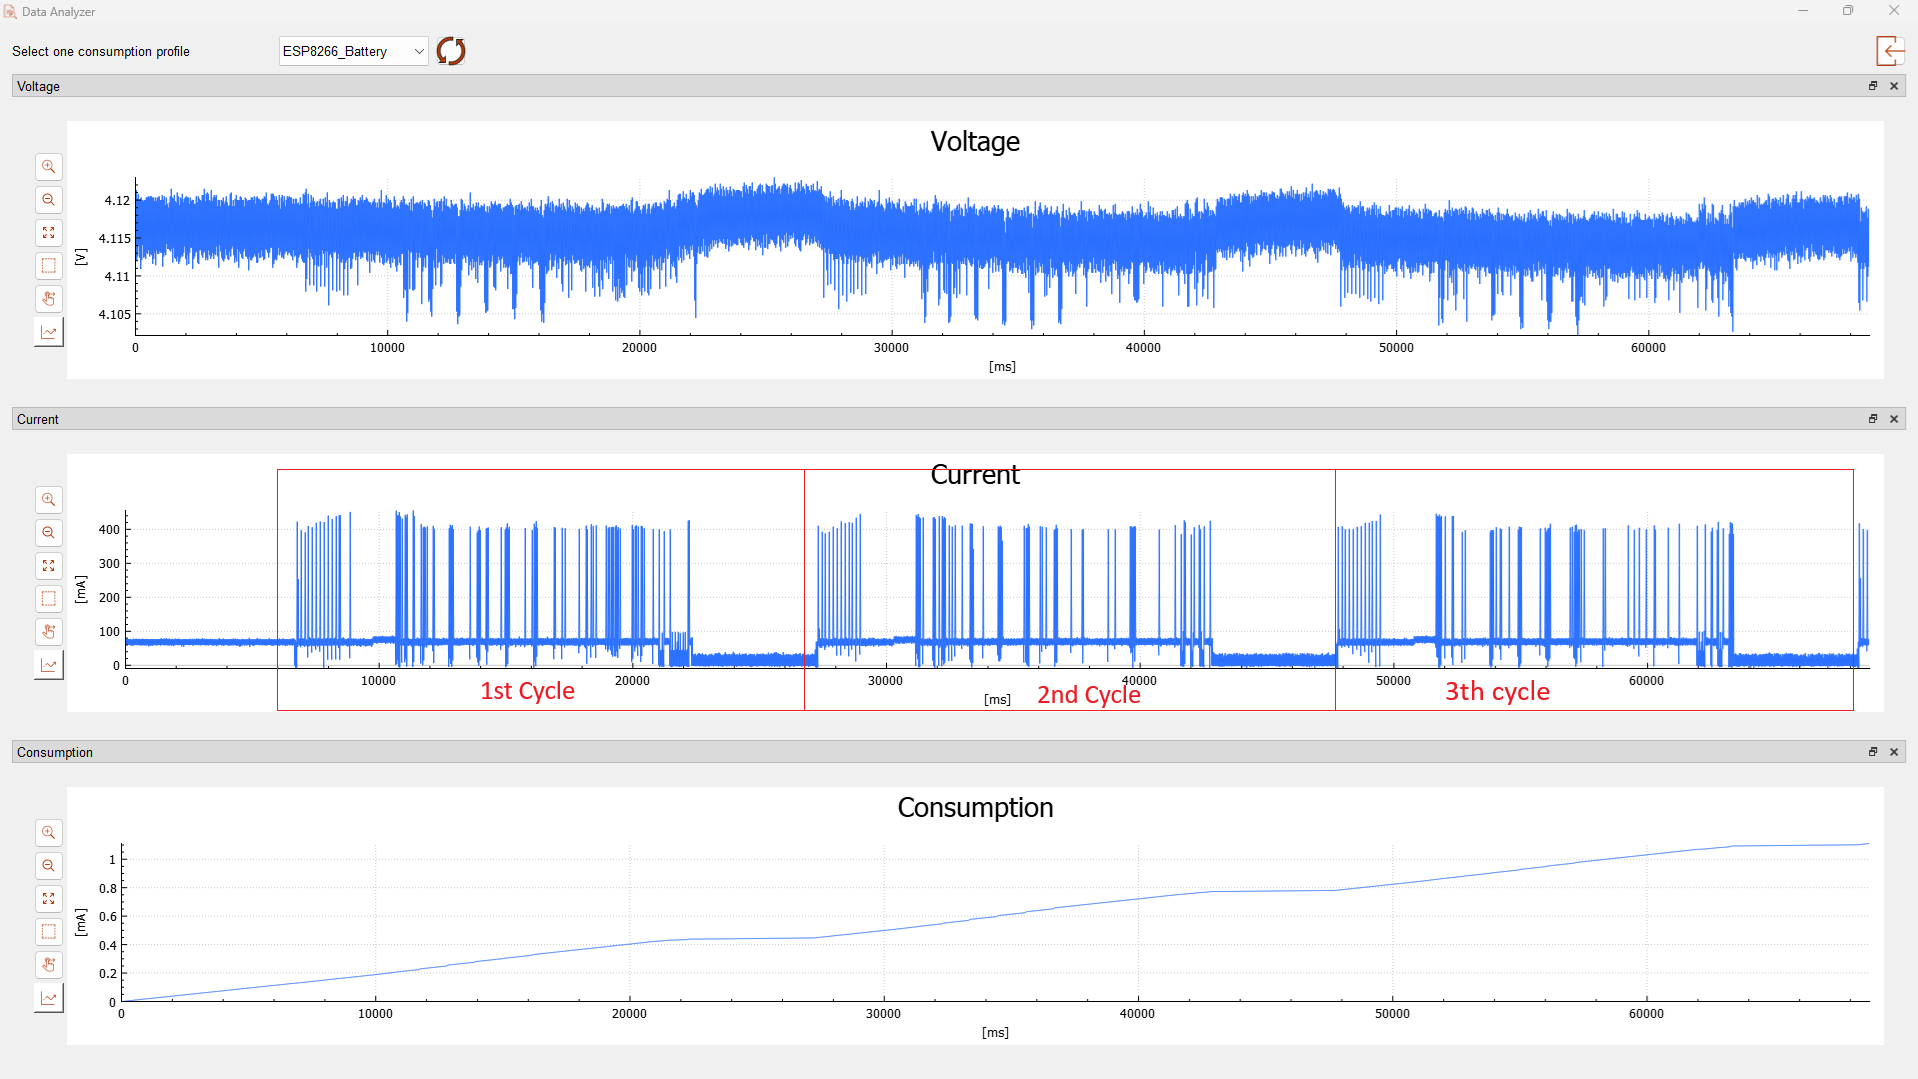
A single cycle is illustrated in Figure 11. As previously explained, the program logic consists of several key stages: an initialization phase where all relevant peripherals are set up and communication with the UDP server is established, a phase where the ESP32 transmits 10 kB of data over five cycles with a one second pause between each, another phase where it transmits 5 B of data over five cycles with a one second pause between each, and finally, a phase where the ESP32 enters DeepSleep mode. These phases are depicted in Figure 12.
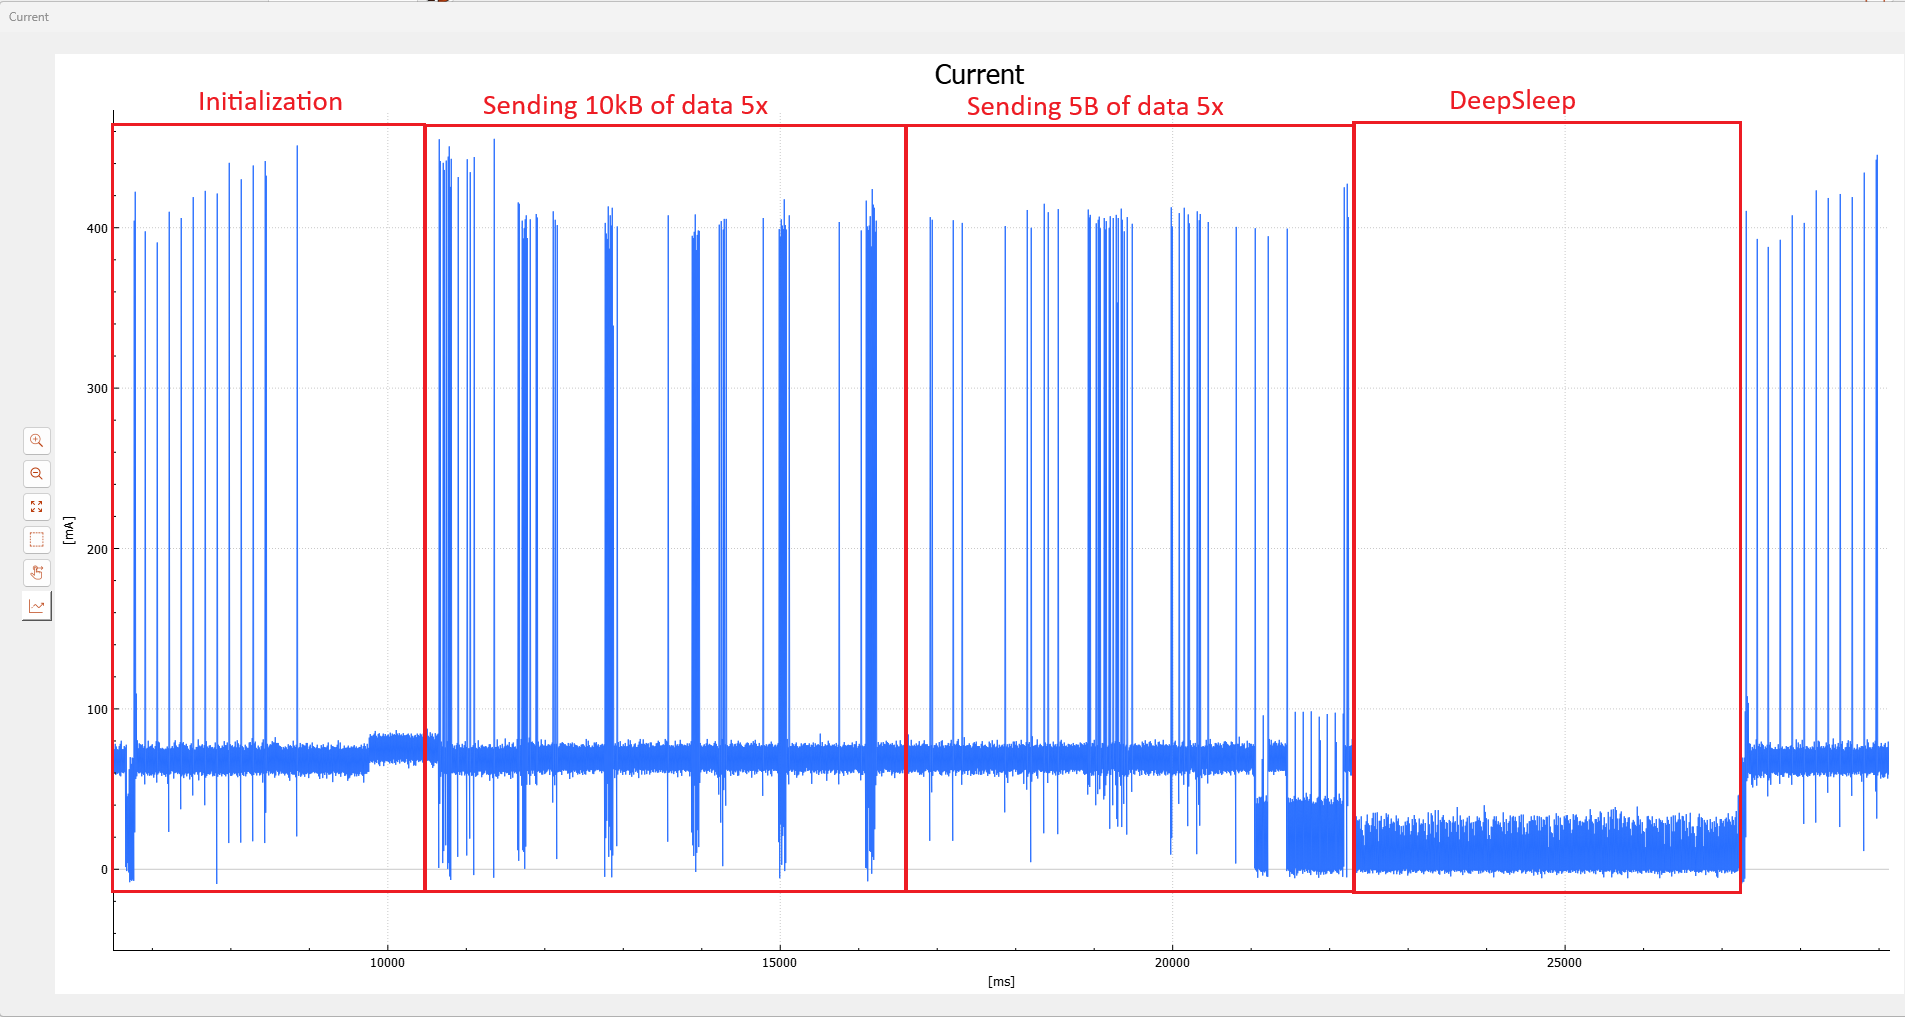
As shown in the figure, there is a relatively large variation in current when the ESP32 performs different Wi-Fi-related activities, leading to an increase in the average ESP current. These variations also cause minor voltage drops in the battery, as illustrated in Figure 14.
Conclusion
The first testing scenario was valuable in assessing the limits of the OpenEPT hardware and evaluating its noise performance. It demonstrated that integrating an external ADC and consolidating all components onto a single PCB significantly reduces noise.
The second testing scenario highlighted the primary advantage of OpenEPT compared to other energy profiling platforms: its ability to capture rapid current variations while providing all the necessary features for detailed analysis.
However, despite measuring the ESP32’s power consumption for a predefined program, it remains challenging to directly correlate specific program sections with their respective consumption profiles. The upcoming Energy Points feature, which will soon be integrated into the OpenEPT system, aims to address this issue by enabling the generation of an energy footprint for each function.


